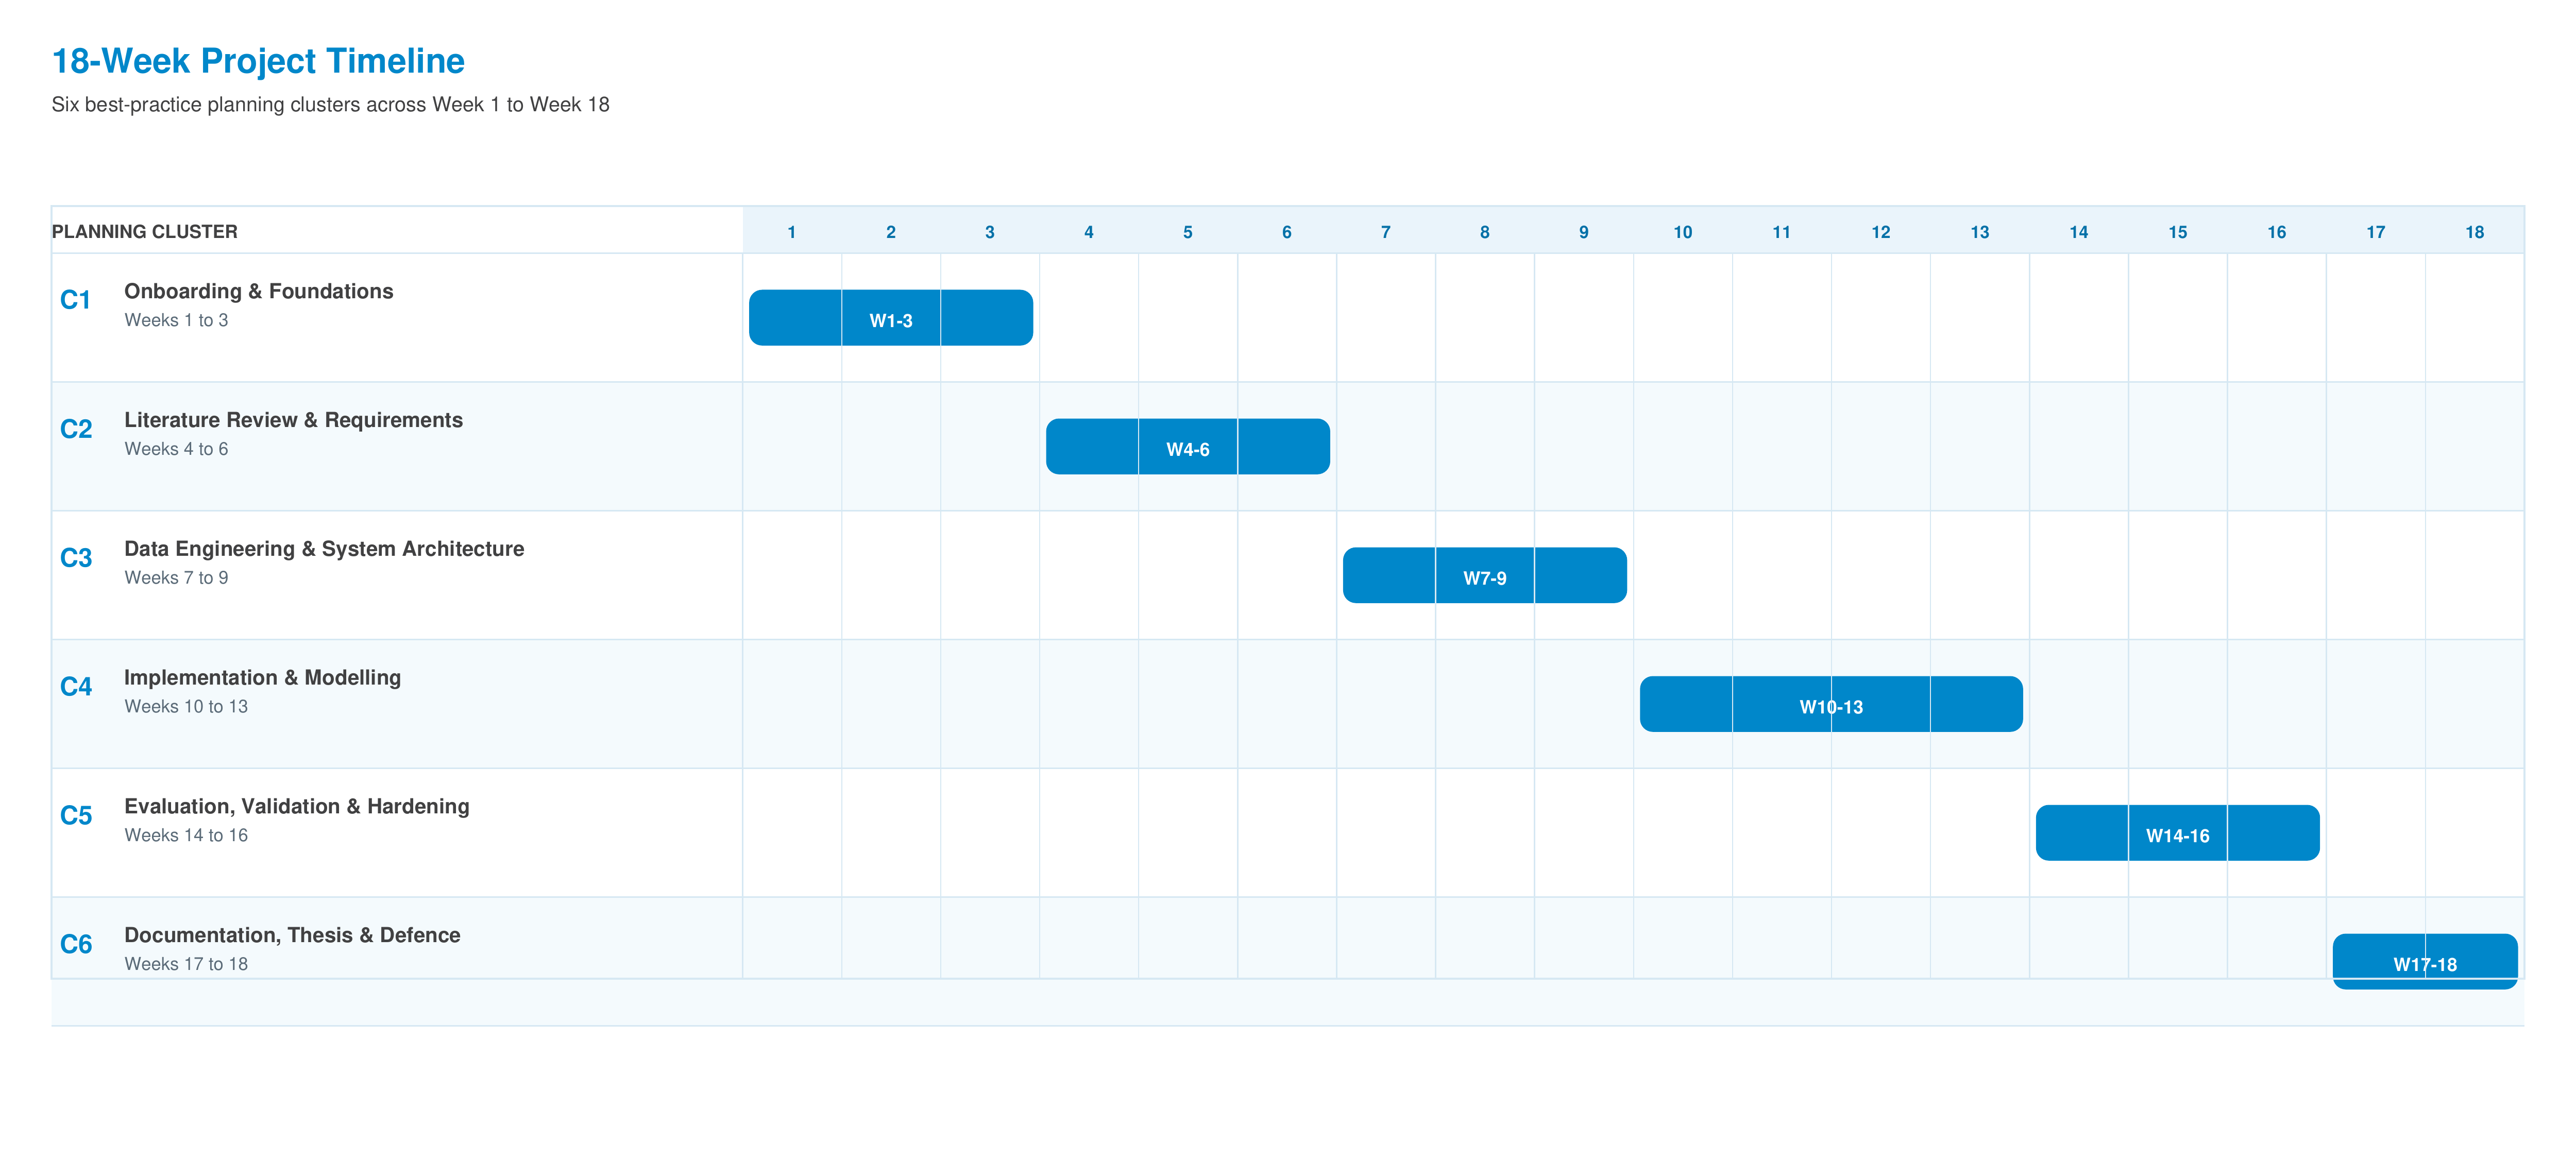
The plan is organised into six best-practice planning
clusters spanning 18 weeks. Each cluster states its focus, key activities and a
milestone that must be reached before the next cluster begins.
Weeks 1-3
Cluster 1 - Onboarding & Foundations
Settle in, set up the working environment, and agree the detailed plan and success criteria with the academic and industrial supervisors.
Key activities
- Onboarding at Graha International: tooling, data-governance and NDA briefing.
- Familiarisation with ESG frameworks, knowledge graphs and GraphRAG concepts.
- Set up a reproducible environment: version control, experiment tracking and a containerised workspace.
- Refine scope, success criteria and the detailed 18-week work plan with the supervisor.
Milestone, Approved internship work plan and a running, reproducible development environment.
Weeks 4-6
Cluster 2 - Literature Review & Requirements
Build the scientific foundation through a structured literature review and a precise requirements and evaluation specification.
Key activities
- Structured literature review on GraphRAG, retrieval-augmented generation and knowledge-graph grounding.
- Survey of ESG reporting standards, taxonomies and disclosure frameworks.
- Stakeholder and requirements analysis; definition of the core use cases and KPIs.
- Draft the conceptual approach and the evaluation methodology with metrics and baselines.
Milestone, Literature-review report and an agreed requirements and evaluation plan.
Weeks 7-9
Cluster 3 - Data Engineering & System Architecture
Prepare the ESG data assets and design the end-to-end GraphRAG architecture.
Key activities
- Collect and clean representative ESG documents and structured indicators.
- Design the ESG ontology and Knowledge Graph schema (entities, indicators, relations).
- Design the GraphRAG architecture: ingestion, graph store, retriever, generator and explanation layers.
- Specify the retrieval strategy and the interfaces between components.
Milestone, Architecture design document and a populated ESG Knowledge Graph.
Weeks 10-13
Cluster 4 - Implementation & Modelling
Implement the GraphRAG platform and the ESG-insight generation components.
Key activities
- Build the ingestion pipeline that populates and updates the Knowledge Graph.
- Implement graph-aware retrieval that assembles evidence subgraphs for each query.
- Integrate the LLM generation layer with graph context and source citation.
- Build an explainable ESG-summary view with evidence and source traceability.
Milestone, Working ESG GraphRAG prototype covering the core query-to-insight use case.
Weeks 14-16
Cluster 5 - Evaluation, Validation & Hardening
Evaluate, validate and harden the prototype with a focus on factual grounding.
Key activities
- Define and run experiments on retrieval quality, factual grounding and explanation faithfulness.
- Compare GraphRAG against standard prompting for hallucination and source coverage.
- Assess robustness to incomplete data; check reproducibility of results.
- Iterate on the graph schema, retrieval and prompting based on the findings.
Milestone, Evaluation report with quantitative results and a validated, hardened prototype.
Weeks 17-18
Cluster 6 - Documentation, Thesis & Final Defence
Consolidate the documentation, draft the thesis material and present the results.
Key activities
- Consolidate code, documentation and reproducibility instructions.
- Write the thesis-ready report covering method, results and limitations.
- Prepare and deliver the final presentation and a live demo.
- Hand over the platform, the Knowledge Graph and the backlog of future work to Graha.
Milestone, Final thesis-ready report, final presentation and a complete handover package.